GravitySlider


The Liftoff brand aims to provide the most advanced and detailed drone simulation systems on the market. Our authentic flight behavior and physics form the foundation of all Liftoff products and are the result of dozens of simulated systems working together.

Liftoff drone simulations use state-of-the-art models based on real-life test results and CFD simulations. Drones in our simulators are highly customizable, with components featuring true-to-life specifications that are realistically factored into the flight behavior.

While our virtual pilots sometimes ask about gravity sliders, there's more to physics than gravity only... and we can confidently say gravity needs no sliding. On this page we go in more detail about the various aspects of the Liftoff simulation technology.

Simulated forces

There are four forces that predominantly affect drone flight:

  • Weight: a downwards force caused by gravity
  • Thrust: a propulsive force generated by the propellers
  • Drag: a force opposing the drone movement caused by air resistance
  • Lift: a mechanical force generated by a solid object moving through a fluid


Weight

In an inertial reference frame, weight is a downward force that is proportional to the drone's mass and the gravitational acceleration. The drone's mass is well known based on the parts selected. Gravitational acceleration is well attested and can safely be considered constant. There are slight variations depending on location, but they do not have a noticeable effect on flight behavior and even so drones generally do not have enough range for these differences to become relevant.


Thrust

Thrust is generated by the rotating propellers of a drone. Propeller blades are shaped like airfoils. While slicing through air, they raise static pressure underneath them, thereby pushing the drone in the opposite direction.

For our Physics 3.0 update, we developed a new thrust model based on a curated database containing tens of thousands of data points from rigorous lab tests. Our model uses part specifications to determine the maximum RPM of a loaded motor, the static thrust at a given RPM, and finally dynamic thrust.

This dynamic thrust is then further adjusted by ground effects. Hovering close above a surface alters airflow, resulting in a higher pressure difference between the top and bottom side of the propellers, increasing available thrust. This effect depends, among others, on the type of surface, the distance to the surface and the pitch of the propellers.

Liftoff part to thrust pipeline illustration

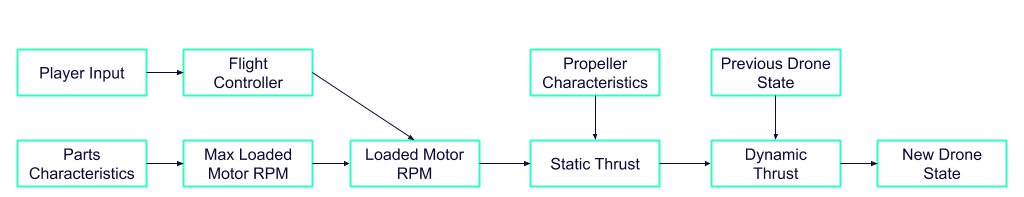
Liftoff's drone state calculation pipeline

This approach insures a high degree of accuracy regardless of what parts a drone might be using.


Drag

Our Physics 4.0 update focused mainly on drag calculations. Drag, sometimes also called air resistance, is a force that counteracts the movement of the drone. The strength of drag depends on many factors, the foremost being the surface area of the drone, as projected onto its velocity.

Projected area

One way to visualize the drone's surface area is to imagine a camera looking back towards the drone from a little further along its current trajectory. The silhouette of the drone as seen from this perspective is the projected area. While that silhouette is easy to picture when flying straight forward, it's much harder to imagine when the drone is performing freestyle tricks or rounding tight corners during races.

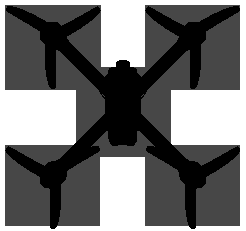
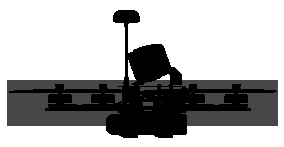
On the following illustration, the projected area as approximated before Physics 4.0 is shown in gray, whereas the more accurate projection from Physics 4.0 is shown in black.


Projected area when free-falling horizontally, propellers not rotating Projected area when the drone's velocity points sideways (relative to the drone itself)


Efficient estimation method

As a first approach to calculate the drone's projected area, we tried implementing a camera that continuously filmed the drone. This gave perfectly accurate data, but had a significant performance overhead. Instead, we settled on an approach where 42 different angles were pre-computed before flying, which the simulation can then interpolate between at runtime. In this way, we consistently obtain an accuracy of over 98%, with no performance impact.

Sampling Visual

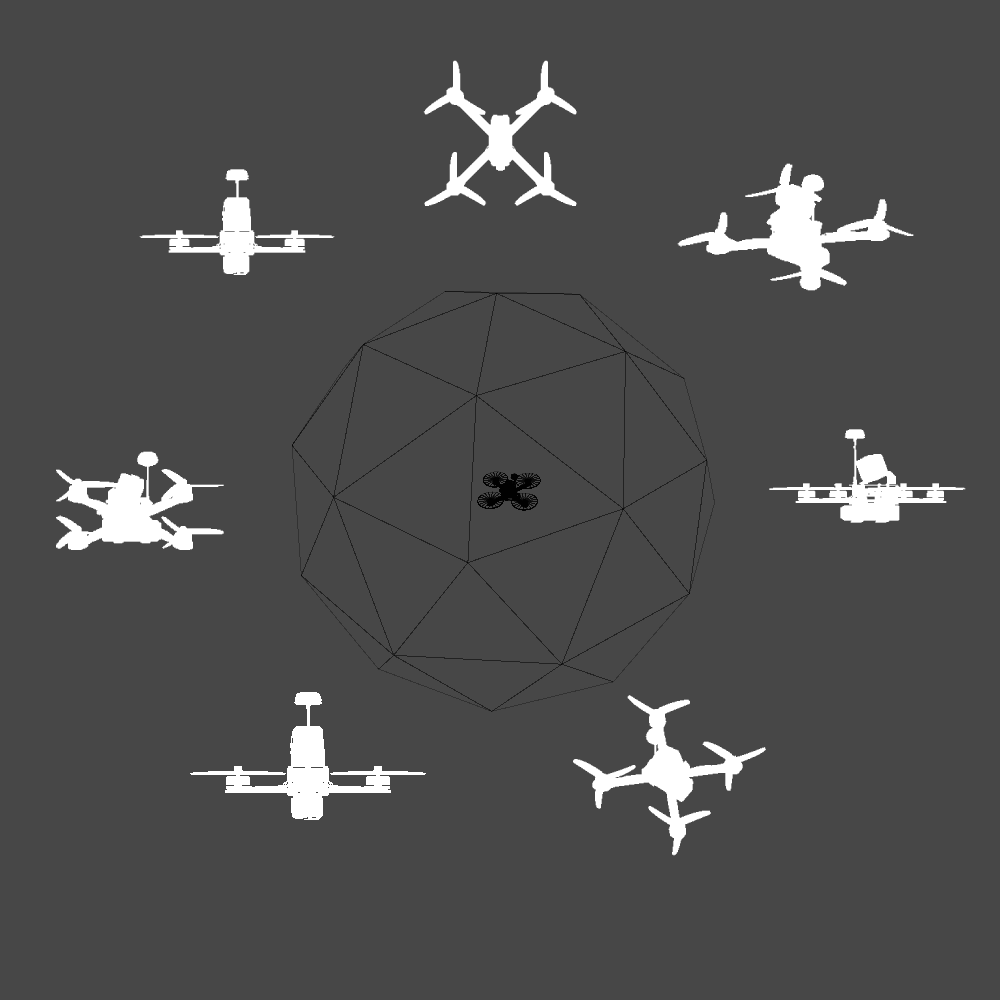
Projected area sampling process: each point on the icosphere is a sampled angle


Lift

Lift is a mechanical force generated by a solid object moving through a fluid. An exhaustive physical model of lift is quite complex and still subject to discussion today. In general terms, however, lift is influenced by the fluid's properties (density, viscosity and compressibility), the surface area of the solid object, its shape and velocity, and its angle relative to the fluid flow. Lift is perpendicular to the flow and thereby also to drag.

Lift is caused by a pressure difference and a change in flow velocity. Imagine an airfoil (the typical "wing" shape) flying forward and tilted slightly backward. On the bottom side of that airfoil, the air velocity will be lower and pressure higher, while the opposite holds for the top side. This creates a vertical upward force on the airfoil.


Air pressure visualization around a moving airfoil

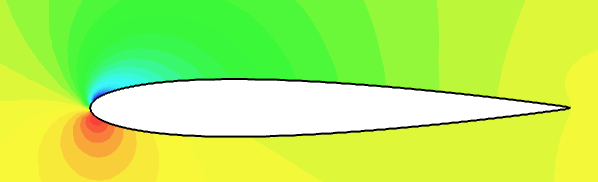
Visualization of the air pressure around a moving airfoil (green: low pressure, red: high pressure)


Although most drones are not specifically airfoil-shaped, they still generate lift in a similar manner. Consider a drone flying in straight line while pitched forward. Given the drone's orientation, this time the high pressure zone is above and the low pressure is below. In this case, lift actually points downwards!


Thrust, drag and lift direction in the case of a drone flying in straight line (force scale is not representative)

Flight controller

Liftoff simulators use a collection of realistic flight controllers backed by virtual recreations of the sensors one would find on modern drones: gyroscope, accelerometer, GPS, barometer, altitude sensor....

The flight controller receives the pilot's input through a radio receiver. Based on its sensor data, it then transmits a certain voltage (indirectly through ESCs) to the motors in order for them to reach a target rotation speed, resulting in a certain amount of thrust from the attached propellers. Most flight controllers use PID controllers to micro-manage motor rotation speed and correct for any disturbances. This micro-managing happens at a very high frequency and allows the drone to constantly adjust its flying, smoothly and with great precision, no matter the potential disturbances (wind, damaged propellers, collisions...).

Rather than simply replicating the superficial effects of flight controllers, our simulation code simulates their entire functioning. Our most sophisticated flight controller makes the same calculations as a real-life one. Given that PID tuning is a fundamental aspect of real-life drone tuning, the one-to-one match between simulation and reality holds great training potential.

That being said, PID tuning can be overwhelming for some players. In order to minimize the time needed from building a drone to flying it, we designed A.I. PID tuning, a feature automatically finding the optimal PID gains for a specific drone. This new, innovative A.I. feature, along with the state-of-the-art techniques from the fields of control theory and digital signal processing used in Liftoff Physics 5.0 make the Liftoff flight controller easier to use, more efficient and more precise than ever.

Battery simulation

Battery life is an important factor in drone applications and often presents a bottleneck for specific missions. An accurate and realistic simulation of the battery discharge is therefore critical part of the Liftoff simulators.

A typical lipo battery has a discharge profile that will be slightly above 3.7v when freshly charged, drop down and stabilize at 3.7v and quickly fall off at the end. We take into account the amp draw of the drone to discharge the battery and get the voltage from its discharge profile.

Besides the discharge profile, there are the continuous and burst discharge c-ratings. These determine how fast a battery can provide its energy. Flying near the continuous discharge rating of a battery will allow you to keep cruising without any adverse effects on the battery. Flying near the burst discharge rating of a battery will cause heat to build up and will also lower voltage. This will slowly recover as the battery cools down when landed or flying slowly.

Voltage sag occurs when a battery is loaded; voltage will drop and recover as the load increases and decreases. While mostly harmless, it's important to not push too hard when voltage is already low (either due to heat or due to low charge) to avoid damaging the battery.

Signal strength simulation

Two distinct radio signals are involved in drone piloting:

  • A real-time video feed (emitted from the drone's VTX)
  • The RC signal (emitted from the pilot's controller)

Depending on the power of the signal, its frequency, and the environment, radio signals can degrade or even be lost entirely. Consequently, the radio signal is often the limiting factor in a drone's maximal operating range.

Liftoff simulators simulate degradation of the video signal. Depending on the drone's position relative to the pilot and the shape or material of any obstacles in between, the video feed will become more distorted and noisy.

RC signal degradation can also be simulated, but is generally only enabled for industry-oriented products, as this level of realism can be frustrating in a more game-oriented setting.